Perspectiv private beta · Q2 2027 · CRM and Knowledge hub first. Other capabilities follow in stages.Apply for the private beta →
From first step to next action
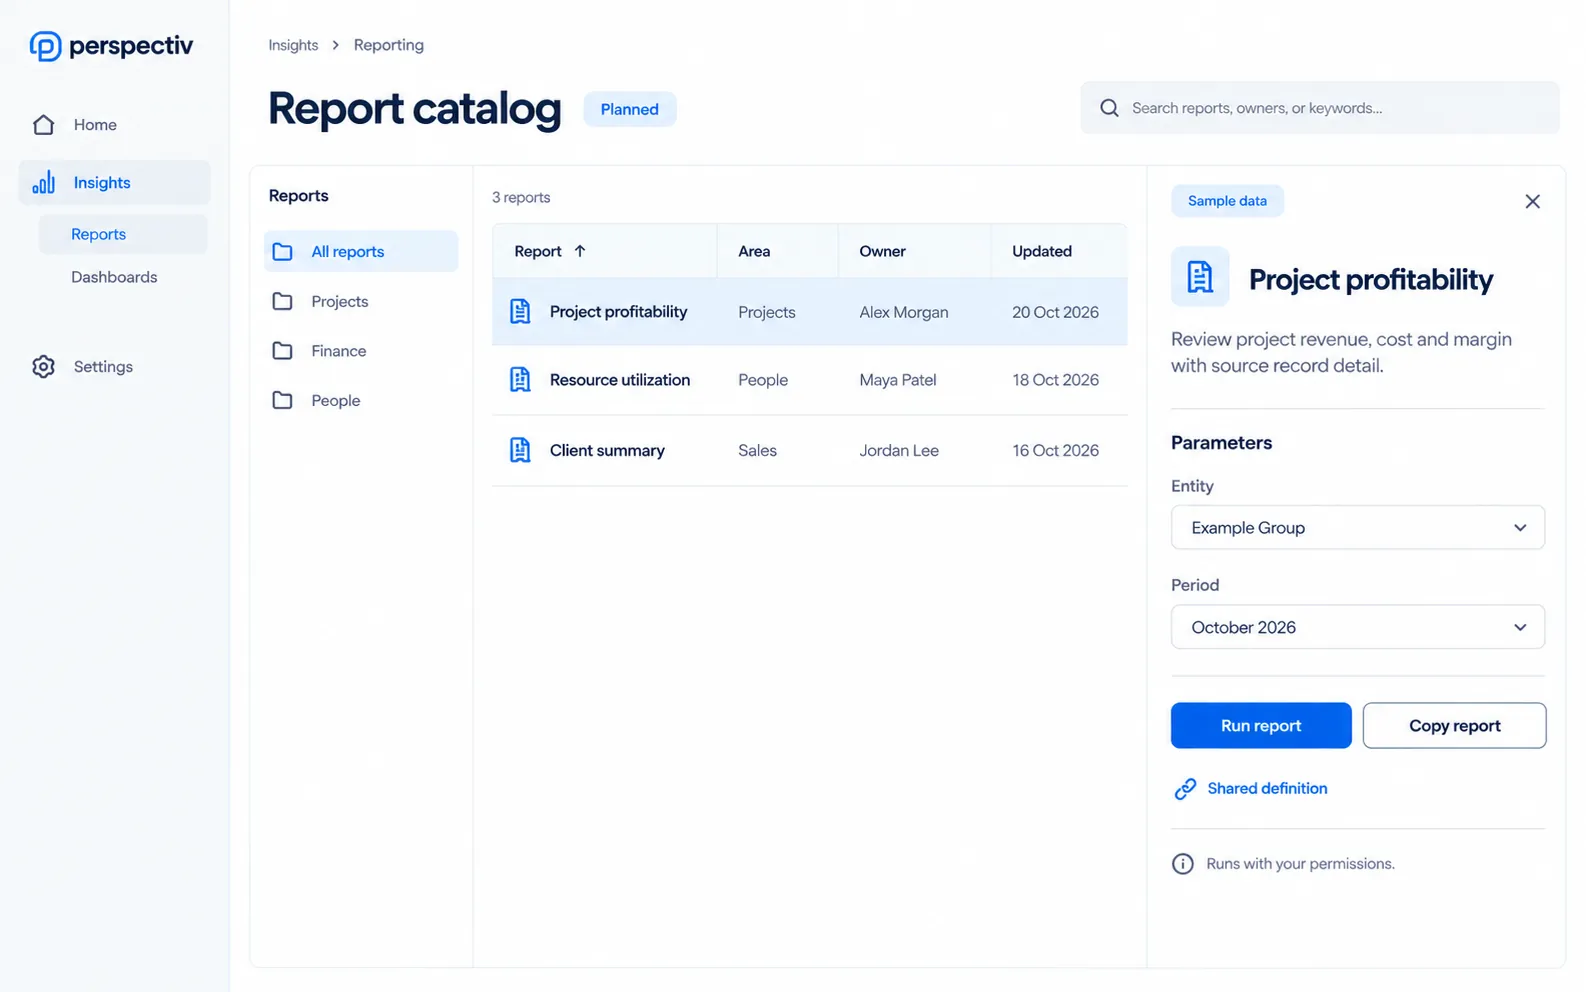
- Choose a reportBrowse the catalog, search by keyword, or copy a report to start.
- Set the contextSelect the parameters that matter, such as entity, period or owner.
- Explore the detailDrill from a total into the underlying records to see what makes up the result.
- Share the definitionShare with your team. Each reader sees data based on their own permissions.
Built around your work
- Find the right reportSearch a catalog with folders and tags, or copy a report to start.
- Build a useful viewUse guided report design and reusable calculations.
- Explore the sourceDrill from a total into the underlying records.
- Share with the right accessShared definitions run with each reader’s own permissions.
Connect to your own semantic models Later Each recipient sent only their own data Later
Everything in Reporting & analytics
See the whole business at a glance, and drill into any number. Items marked Later come in a later phase.
Reports
- Operational reporting
- Financial reporting
- Project profitability reporting
- Resource utilization reporting
Dashboards
- Dashboards and KPIs
- Report and dashboard design
- Forecasting dashboards
- Cross-module analytics
Sharing
- Scheduled reporting and exports
- Shared report definitions
- Reports available inside each module you’re licensed for
- Reports run with each reader’s own permissions
Find and build reports
- A searchable report catalog with folders and tags
- Build your own reports with a guided builder
- Copy an existing report as a starting point
- Reusable calculated fields, ratios and variances
Dig into the numbers
- Drill from totals to the source records
- Profitability by client, contract and service line
- Predictive analytics
- Dashboards show when data was last refreshed
Power BI
- Power BI integration
- Embed Power BI reports inside Perspectiv
- Microsoft Fabric: OneLake, Lakehouse and Warehouse
- Power BI access still follows your permissions
- Connect to your own semantic models Later
Trust and share
- Certified badge on approved reports and KPIs
- Compare report versions and roll back
- Export dashboards to PowerPoint
- Branded, print-ready reports
- Each recipient sent only their own data Later
Connected across Perspectiv
Each module keeps its own availability.
Common questions
Questions
Can we use Power BI?
Power BI integration is part of the planned reporting scope.
What comes later?
Your own semantic models and recipient-specific scheduled data delivery are labeled Later.